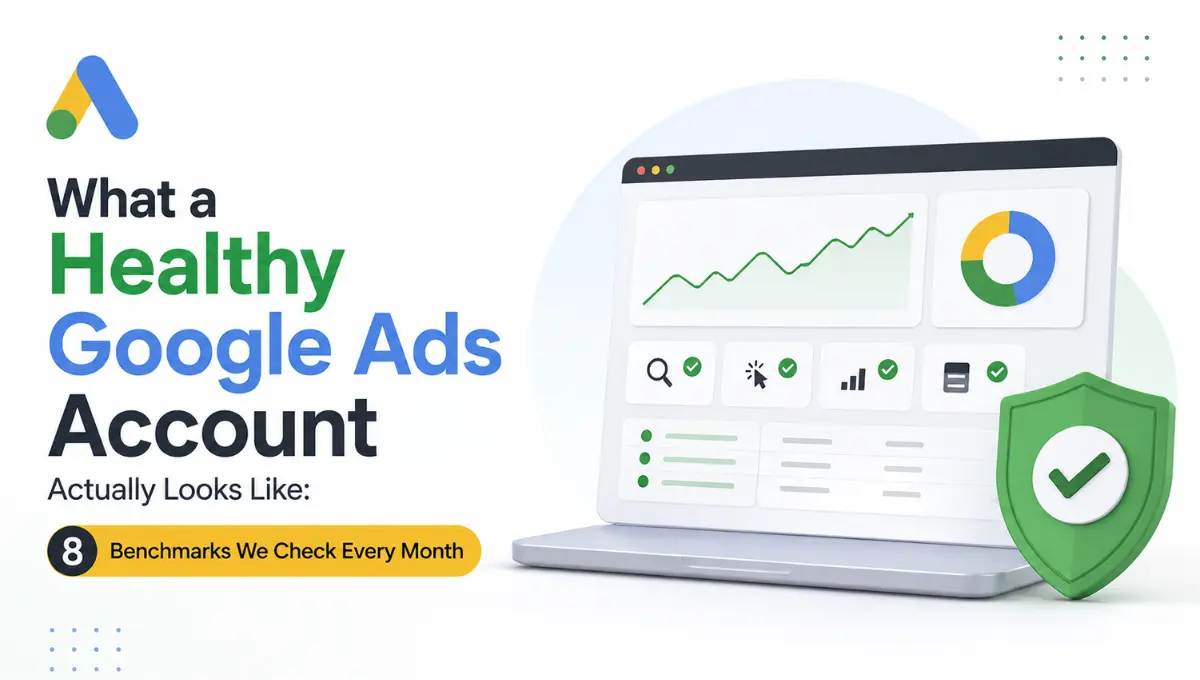
Most Google Ads audits tell you what is broken. The healthy Google Ads account benchmarks for 2026 worth knowing are the ones that tell you what good looks like before something breaks. Eight numbers, checked monthly, that separate an account running well from one that looks fine on the surface and quietly costs more than it should.
There is a particular kind of account that is the most expensive to manage, one that looks healthy on the dashboard and unhealthy in the CRM. Conversions are coming in, ROAS looks strong, campaigns are active. And then someone maps the platform data against the actual pipeline, and the gap is uncomfortable.
The problem is that most optimisation decisions get made on the numbers inside the platform. If those numbers are inflated, misattributed, or measuring the wrong things, every decision built on them is going in the wrong direction with confidence. That is worse than a clearly broken account, because a broken account is obvious. An account that looks healthy but is not keeps running on bad inputs until the business result eventually forces the conversation.
The eight benchmarks below are the ones that catch the gap between what the platform is reporting and what the business is actually getting.
Benchmark 1 and 2 are Quality Score Distribution and What It Costs When It Is Low
A healthy account has 70 percent or more of its keywords at Quality Score 7 or above. Quality Score is Google’s 1-to-10 rating of how relevant the keyword, ad, and landing page are to the search, and pushing into the 8-to-10 range reduces CPC and improves ad position without increasing bids.
Below-average Quality Score on core keywords means the relevance chain between keyword, ad, and landing page is broken somewhere, and the account is paying a CPC premium on every click while it stays that way. The average account runs between 5 and 7. An account with most of its core keywords below that range is paying more per click than it should for every impression it wins.
The second benchmark sits alongside this one, branded Impression Share above 80 percent on core brand terms. If competitors are capturing brand searches, no amount of optimisation on non-branded campaigns compensates for that leakage. Brand terms convert at high rates because the user is already looking for the business. Losing those impressions to a competitor is a pipeline problem that does not show up obviously until you pull the branded IS report.
Benchmark 3 is Whether Smart Bidding Has Enough Signal to Actually Optimise
Conversion volume above 30 per month per campaign for tCPA and above 50 per month for tROAS is the threshold that separates Smart Bidding in optimisation mode from Smart Bidding in exploration mode. Below those numbers, the algorithm is still learning rather than optimising, and performance will be more volatile than the bid strategy label suggests.
A healthy account has enough conversion volume per campaign to keep Smart Bidding out of the learning phase consistently. An account running five campaigns each generating eight conversions a month is not running five campaigns with Smart Bidding. It is running five extended learning phases that never stabilise. Consolidating campaigns to get each one above the conversion threshold is one of the most impactful structural changes in most accounts, and it is invisible in the dashboard until the volume numbers are checked directly.
Benchmark 4 and 5 are Where the Budget Is Actually Going
An invalid click rate below 5 percent is the threshold that keeps bot traffic from distorting conversion signals. Above that number, the clicks feeding the algorithm include noise that is training Smart Bidding on patterns that do not represent real buyers. A significant gap between Search Impression Share and actual clicks is one of the clearest signals that invalid traffic is affecting the account at a level worth investigating.
The Search Term report benchmark runs alongside this, a healthy account has 80 percent or more of its spend on intentional search terms, with under 20 percent going to broad-match exploration. If the spend is not explainable in terms of why those queries are appearing and what they convert into, the account has a keyword hygiene problem that is silently consuming budget on traffic with no clear relationship to the business objective.
“A Google Ads account that looks healthy on the dashboard and unhealthy in the CRM is the most expensive kind of account to run — because every optimisation decision is being made on the wrong signal. The 8 benchmarks in this piece are the ones we use every month to catch the gap between what the platform is reporting and what the business is actually getting.”
— Vishal Singh, Performance Marketing Specialist
Benchmark 6 and 7 are QS Trend and Disapproval Rate
Account-level Quality Score trending upward over 90 days is a signal that the account is becoming more relevant over time, which is what active management should produce. Flat or declining QS over 90 days signals structural issues that are not resolving on their own, keyword-to-ad relevance gaps, landing page mismatches, or ad copy that is not keeping pace with what users are searching for.
The disapproval rate benchmark is simpler but often overlooked. A Google Ads account health check monthly audit should confirm that the disapproval rate across active ads stays below 2 percent. Higher than that means ad copy or landing pages are systematically triggering policy flags, and those flags accumulate into account history that affects how future submissions are treated. Clean accounts do not accumulate disapprovals. When the rate climbs above the threshold, there is a pattern to find, not just individual ads to fix.
Benchmark 8 is ROAS Cross-Referenced Against CRM Pipeline
This is the benchmark that catches the most important problem, an account that looks efficient on the platform but is not producing results the business actually sees.
A healthy account shows platform ROAS within 30 percent of the blended efficiency ratio across the business. A larger gap means attribution is inflated and optimisation decisions are being made on false data. The gap usually comes from view-through conversions, brand cannibalization in Performance Max, or assisted conversion credit in data-driven attribution being counted in the platform ROAS without representing incremental revenue.
Cross-referencing platform ROAS against CRM pipeline for the same period is not a complicated exercise, but most accounts are not doing it monthly. The ones that are doing it catch attribution drift before it compounds into a budget allocation problem.
What Healthy Looks Like vs What Looks Healthy
An account that is genuinely healthy, QS averaging above 7 on core keywords, branded IS above 80 percent, conversion volume above 30 per campaign per month, invalid click rate below 5 percent, 80-plus percent of spend on intentional terms, QS trending up over 90 days, disapproval rate below 2 percent, and platform ROAS within 30 percent of blended efficiency ratio.
An account that looks healthy but is not, strong summary ROAS driven by view-through credit and branded cannibalization, conversion volume spread across too many campaigns to let any of them exit the learning phase, broad-match exploration running above 30 percent of spend with nobody explaining why, and disapprovals accumulating in the background while active campaigns continue to serve.
The difference between the two is visible when the eight benchmarks are checked together. It is invisible when the dashboard is read at face value.
What Gets Asked When Teams Start Running These Benchmarks Monthly
Q1. How do you improve Quality Score when it has been flat for months?
Ans. Start with the keyword-to-ad relevance layer. If the ad copy does not closely mirror the search intent behind the keyword, QS will not move regardless of what the landing page does. Tighter ad group themes with more specific ad copy are the fix that moves QS fastest in most accounts, before landing page changes are even needed.
Q2. What is the right response when invalid click rate goes above 5 percent?
Ans. Check Search Impression Share against actual clicks for unexplained gaps, and review the IP exclusions and placement exclusions in the account. For Display and PMax campaigns, reviewing where ads are appearing and excluding placements that show high impressions with unusually low or zero conversions usually surfaces where the invalid traffic is coming from.
Q3. Why does the ROAS-to-CRM cross-reference matter if the platform optimisation is working on platform data?
Ans. Because the platform is optimising toward whatever signal it receives, and if that signal is inflated, the campaign is being tuned to produce results that look good on the platform rather than results the business actually wants. Platform ROAS within 30 percent of the blended efficiency ratio is the check that confirms the optimization signal and the business outcome are pointing in the same direction.
Written by Vishal Singh, Performance Marketing Specialist
I run monthly Google Ads account health reviews across agency and direct-client accounts. The eight benchmarks in this article are the ones that consistently surface the gap between how an account looks and how it is actually performing.
For more on how we manage paid search performance and account health, visit our search engine marketing services.