
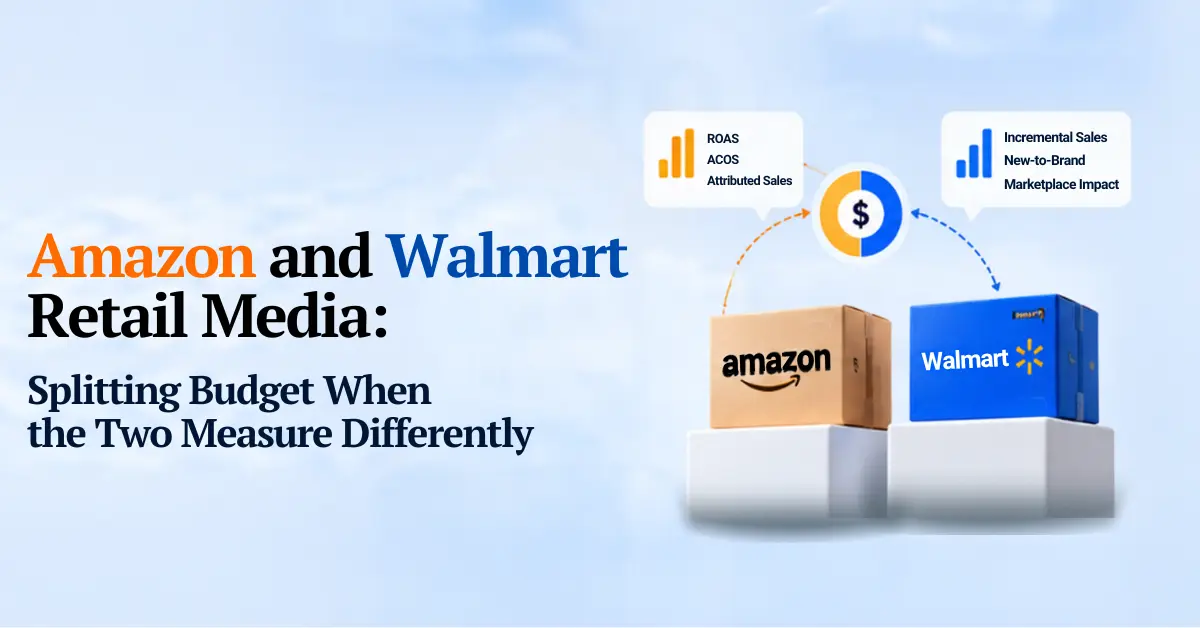
Amazon vs Walmart retail media can’t be judged on ROAS alone. The two platforms count sales differently. Amazon mostly sees what gets bought on Amazon, while Walmart can also tie an ad to a sale in its stores. Split budget by where your product really gets bought and look at that split again every quarter.
Here’s how most brands do it. Someone pulls up the Amazon report, someone else pulls up Walmart’s, and whichever ROAS number is bigger walks away with next month’s money. Quick decision. Probably the wrong one, and about as fair as asking a fish and a cat which of them climbs trees better.
And it’s not pocket change we’re talking about. eMarketer reckons Amazon and Walmart soaked up close to 90 percent of the new US retail media dollars in 2026. Tinuiti’s Q1 report had Walmart Sponsored Products spend up 62 percent on the year. Amazon? Up 21. So whatever you decide here is steering a serious chunk of the budget, whether it feels like it or not.
What follows is how we look at the split, the spots where the numbers lie a little, and the stuff we check before anything moves.
Why Can’t You Judge Amazon vs Walmart Retail Media on ROAS Alone?
They’re not counting the same sales. Nobody puts that on the dashboard in big letters, but it’s true.
Amazon’s view stops at Amazon. Click, buy, logged. Walmart can chase an ad a lot further than that, into the app, the pickup counter and the actual store aisle, by matching it up with account and payment data. Say a mum sees your detergent ad on her phone on a Wednesday and picks up a bottle during the Saturday shop. Walmart can tie those together. Amazon can’t, because there’s no Amazon store at the end of her street.
We’ve watched this go wrong in client accounts more than once. Walmart’s first reporting screen leans heavily on online sales, the in-store numbers are tucked into the fuller omnichannel view, and a busy team never clicks through. Walmart looks weak. Money goes to Amazon. Amazon looks like a genius, mostly because it’s easier to measure.
Same-looking scoreboards. Totally different games.
Is the Shopper on Amazon Really Different from the One on Walmart?
Yes, though not in a dramatic way. Enough to matter.
When somebody types “magnesium glycinate 120 capsules” into Amazon search, the hard part’s done. They’ve already decided on magnesium. Now they’re just picking a bottle, and your ad gets to show up right at that moment, which is a nice place to be.
Walmart’s a bit of a mixed bag. Weekly grocery runs, people price-checking three brands, and that one guy who’s bought the same shampoo for six years and will keep buying it until the end of time (fair enough, honestly). You can run the identical ad at the identical bid and land in front of someone in a totally different headspace.
Category shifts things as well. Groceries, household stuff, pet supplies and everyday health products tend to do well on Walmart. Electronics, beauty and supplements, the categories where people happily lose twenty minutes in the reviews, lean Amazon. eMarketer has Amazon holding nearly 80 percent of US retail media ad spend by itself, so it’s no shock it’s everyone’s default. Doesn’t mean it’s the right default for you.
How Should You Split Budget between Amazon and Walmart Connect in 2026?
First question. Where does your buyer actually shop for this thing? Be honest about it, not hopeful.
Something people grab every week probably earns more on Walmart than the online report lets on, thanks to the in-store side. Something people research for days before buying usually does better on Amazon.
Then check what clicks are costing. Tinuiti’s Q1 2026 numbers showed Walmart Sponsored Products spend up 62 percent but CPCs only up 3. Amazon’s spend climbed 21 percent while CPCs moved 2. Skai saw CPCs fall across every retail media category in that same quarter, which it says hasn’t happened once in seven years of tracking. What that tells us is Walmart still has space to test cheaply. That won’t last forever.
A lot of brands start somewhere around 40 to 50 percent Amazon, 20 to 25 percent Walmart Connect, and keep whatever’s left for experiments. Fine as a rough start. It shouldn’t be carved in stone, and whoever looks after your Amazon marketing services ought to be holding it up against your own category data every quarter. Leave a split untouched for a year and you’re basically ignoring new information on purpose.
Nobody wins an Amazon vs Walmart argument by pointing at a dashboard. The two platforms count sales differently, so the real question is where your shopper actually buys, and whether you’re looking at the full report or just the first screen.
— Vishal Singh, Performance Marketing Specialist
Amazon or Walmart Connect, Which Should Get More of Your Budget?
Amazon usually comes out ahead if people research before they buy, if your reviews and product page are doing the heavy lifting, and if you want feedback you can read quickly. The loop’s short. Data’s clean.
Walmart Connect makes more sense for everyday and grocery-style products, for brands that already have decent shelf presence, and for teams who’ll actually dig into the fuller reports. It takes longer to read, no question. You just end up seeing a lot more of what’s really happening.
Considered purchase? Lead with Amazon. Weekly basket item that’s already on Walmart shelves? Push harder on Walmart.
How Long Should You Test before Moving Any Budget?
Longer than you’d like.
Make the call at week four and you’re putting finished Amazon data next to Walmart data that’s still coming in. Amazon wins that comparison every time, and not because it performed better. It just got to the end of its sentence first.
Eight weeks is the minimum we’d give both. After that, pull Walmart’s full reporting and measure the two the same way, with holdout tests or a third-party tool running one set of rules across both. A good ecommerce marketing services setup starts with that kind of baseline, not with two dashboards stapled together.
Frequently Asked Questions
Q1. Why does Walmart's ROAS look lower than Amazon's even when sales are fine?
Ans. Mostly because you’re looking at the first screen, and that’s mostly online sales. The in-store sales your ads drove are in the omnichannel report. Open it first.
Q2. Should a new brand start on Amazon or Walmart?
Ans. Usually Amazon. Clearer reports, faster learning. But if your product suits Walmart, don’t leave it sitting on the side forever.
Q3. How do you compare the two platforms fairly?
Ans. Measure both the same way, with holdout tests or a third-party tool. Taking each platform’s own numbers and adding them up feels like a comparison. It isn’t really one.
Q4. Is it worth running both on a small budget?
Ans. Not straight away, in most cases. Thin budget across two platforms means thin data from both. Start with whichever one suits your category and bring in the second when there’s money to do it properly.
Written by Vishal Singh, Performance Marketing Specialist
I’ve run retail media on Amazon and Walmart for ecommerce brands across categories. The thing that keeps coming up in those accounts? Budget drifting the wrong way because two reports looked like they matched when they didn’t.
If you want a hand figuring out the right split for your brand, take a look at our Amazon marketing services.